

Statistical manipulation misinforms people by use of false measurements.
Vaccine scientists often conceal the true effectiveness of the influenza vaccine through risk calculations. Researchers use a calculation that essentially artificially inflates the effectiveness of influenza vaccines. Rather than use the statistical measure that more truthfully represents vaccine effectiveness, the researchers choose to use a statistical measure that makes vaccines appear more effective than they truly are.
Why is this important?
The published studies that report high effectiveness rates are then used by governmental agencies, your pediatrician, and mainstream media to attempt to increase influenza vaccine uptake rates. In other words – it is a tactic designed to convince you to get the flu vaccine every year.
To understand this specific deception technique, you will need to understand two risk concepts used to obscure findings: Relative Risk (RR) and Absolute Risk Reduction (ARR).
Relative Risk (RR) Explained
Relative Risk compares the chance of a bad outcome between two groups. Statistical definition: the proportion of bad outcomes in the experimental group (group #1) divided by the proportion of bad outcomes in the control group (group #2). Relative Risks under 1.0 indicate the tested medical intervention helped patients, while relative risks over 1.0 indicate the medical intervention hurt patients.
Absolute Risk Reduction (ARR) Explained
Absolute Risk Reduction measures the absolute difference in bad outcomes between two groups (group #1 and group #2). Statistical definition: the proportion of bad outcomes in the control group minus the proportion of bad outcomes in the experimental group (in this case, a larger number means the treatment was helpful, while a small number means the treatment didn’t do much to help, and a negative number means the treatment was hurtful).
Why RR and ARR are Different
Relative risk tells you how badly one group fared in comparison to another group, in relative terms. It’s akin to saying, “Johnny jumped half as high as Timmy” – but you never know how high each of them jumped. Absolute risk reduction – on the other hand – tells you the actual difference in outcomes between the two groups. This would be akin to saying, “Johnny jumped 8 feet high, but Timmy jumped 16 feet high.” One can see that the absolute risk reduction is a more helpful, informative statistical measure; whereas, it’s easier to hide the magnitude of the differences behind relative comparisons.
Again, why is this relevant to vaccines?
The general public is interested in one question: if I choose to get the influenza vaccine, will my chances of getting the flu decrease, and by how much? We are not interested in relative comparisons, we are interested in actual, true differences.
Let’s break down a practical example into 4 easy steps to demonstrate the disparity between relative risk (RR) and absolute risk (AR).
Step 1: Define the Two Groups
Good scientific practice is to separate people into groups as closely numbered as possible, and as well matched as possible, meaning, we attempt to compare groups of people in which all variables are the same (or very similar) except the one variable we’re testing. This way, we can tell that any significant difference between the two groups is due to the variable we’re testing, and not some other variable.
One of the groups will receive the treatment (let’s say vaccine), and another group will receive nothing. This is called the control group. Typically, gold standard medicine would dictate using a saline placebo on the control group (a placebo is a harmless substance that has no effect – used to make the control group think they’re getting the treatment).
In most vaccine experiments, researchers incorrectly use another vaccine or a vaccine ingredient as the placebo. This way, the differences between the two groups will be reduced (muted), and the researchers can report in their conclusions, something to the tune of, “vaccines didn’t increase the amount of adverse reactions significantly.”
So – back to our example.
Let’s assign 25 people to the control group (these people receive the “placebo” that is actually another vaccine or a vaccine ingredient), and 25 people to the vaccine exposed group (these will be the people who get the vaccine).
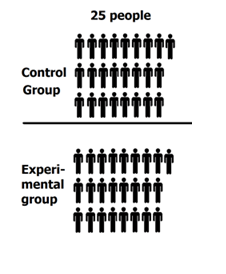
Step 2: Implement the treatment and Observe Results
So, the 25 people in the control group receive a placebo, and the 25 people in the experimental group receive the vaccine.
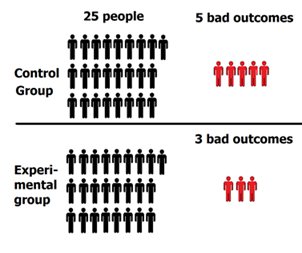
The results: 5 people in the control group experienced a bad outcome and 3 people in the experimental group experienced a bad outcome.
*Note: “Bad outcome” means that the person contracted influenza. These outcomes will be used to determine vaccine effectiveness a bit later in the article.
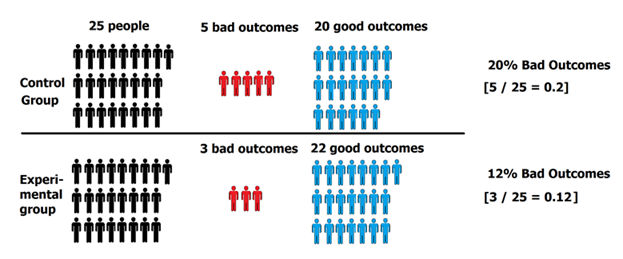
Step 3: Determine percentage of “bad” outcomes in control group and experimental group.
5 people had bad outcomes in the control group, while 3 people had bad outcomes in the experimental group.
So, the percentage of bad outcomes for each group would be:
- Control Group = 5 bad outcomes ÷ 25 people total in control group = 20%
- Experimental Group = 3 bad outcomes ÷ 25 people total in experimental group = 12%

Step 4: Calculate Relative Risk (RR)
Divide the percent of bad outcomes in the experimental group by the percentage of bad outcomes in the control group:
- 12% ÷ 20% = 0.6 or 60%
Step 5: Calculate Vaccine Effectiveness
The next step researchers take is to calculate vaccine effectiveness.
Vaccine Effectiveness (VE) = 1 – Relative Risk (RR)
Why is the relative risk value subtracted from 1? Remember, a value of 1.0 means that the vaccine didn’t cause a positive or negative impact on effectiveness (1 = no impact).
Given we calculated a relative risk of 0.6, in order to determine the magnitude of the benefit from the vaccine, we subtract it from 1.
Using the relative risk value of 0.6 (60%), we now plug into the vaccine efficacy formula:
- VE = 1 – 0.6 = 0.4, or 40%
So, our vaccine effectiveness is 40%.
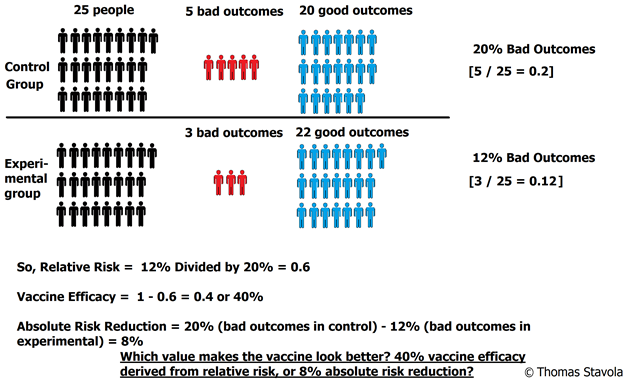
Step 6: Calculate Absolute Risk
Now, we have our vaccine effectiveness value, which the researchers obtain from relative risk. But the relative risk doesn’t tell us the true difference in vaccine effectiveness between group #1 and group #2. So, now we look toward absolute risk reduction – the measure that is much more representative of reality.
In order to find absolute risk reduction, we subtract the percentage of bad outcomes in the control group from the percentage of bad outcomes in the experimental group:
- 20% – 12% = 8%
So, our absolute risk reduction is 8%.
This is in stark contrast from the vaccine effectiveness, or 40% — looks a little different, doesn’t it?
With those same original data and the associated bad outcomes (flu cases), we came up with two completely different results on vaccine effectiveness.
Notice that the vaccine effectiveness, derived from relative risk, “looks” a lot better than the absolute risk reduction of only 8%. This is why the published study results always use relative risk; relative risk makes the vaccine look better (more effective) than it really is.
Application to a Randomized Controlled Trial on the Influenza Vaccine
Now let’s apply these statistical formulas to an actual randomized controlled trial. The study, conducted by Beran, et al., 2009, examined the 2006-07 influenza season:
“Efficacy of inactivated split-virus influenza vaccine against culture-confirmed influenza in healthy adults: a prospective, randomized, placebo-controlled trial.”
| Intervention | Influenza Count | Group Size |
| Vaccine | 49 | 5103 |
| Placebo | 74 | 2549 |
Figure 1
There were 49 incidences of “influenza like illness” in the vaccine group, and 74 incidences of “influenza like illness” in the placebo group (see Figure 1). Since this is only a random sample, we need to determine whether the difference between the two groups is an effect that exists in the entire population. For this, we use a hypothesis test – 2 proportions test (see Figure 2).
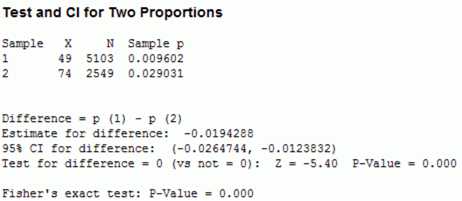
Figure 2
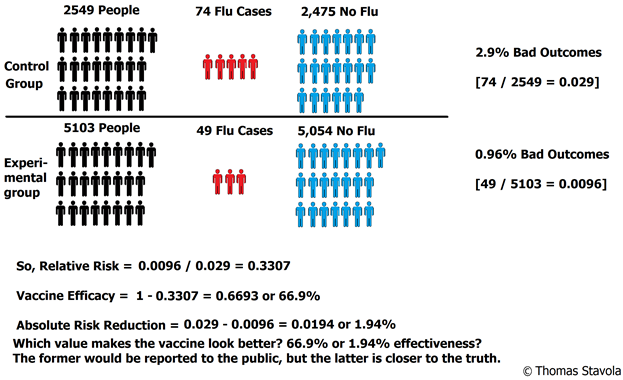
So, the results here mean that the reported vaccine effectiveness in this study is 66.9%, yet, the actual absolute risk reduction (or true difference between the vaccinated and control groups) is only 1.9%! That’s an incredibly significant difference. The general populace would be led to believe the vaccine is 67% effective, yet the data indicates the difference is extremely small.
Here’s another similar study for your own independent investigation – the differences between absolute risk and relative risk are very significant here, too!
Final Analysis
The sample size in the placebo group should have been much higher to improve accuracy (5103 people in the vaccinated group, and only 2549 people in the control group). This is a point unaddressed in the article thus far.
Just for argument’s sake: if the control group had 5103 people – the same number as the experimental group, what would the absolute risk reduction be? Remember, the absolute risk reduction was only 1.9% with the previous data. If we had equally numbered groups, the absolute risk reduction would be 0.49%! That’s essentially no difference between the vaccinated and placebo groups. As an aside: there may be other confounding/contaminating variables that impact effectiveness values, like medical history/health status of the participants.
One can plainly see that vaccine effectiveness – frequently touted by mainstream media sources and governmental health agencies – are exceptionally deceptive. Why? Because they are derived from relative risks rather than absolute risks.
Vaccine effectiveness is really the inverse of what you want to know!
Absolute risk is a much more truthful measure than relative risk, as it gives you the actual difference between the two groups.